Cities tell stories through their evolution. From small settlements to sprawling metropolises, urban areas transform dramatically over decades and centuries. Understanding these changes requires more than just numbers—it demands powerful visualization tools that can capture the complex patterns of urban expansion.
Historical Context of Urbanization
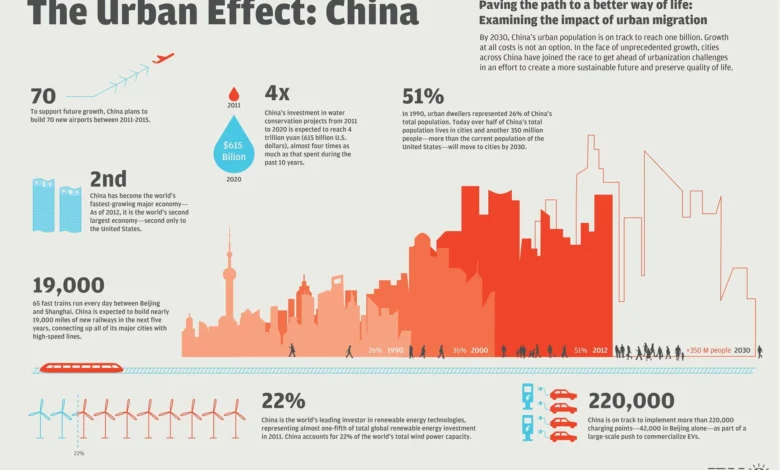
Urban growth has accelerated dramatically since the Industrial Revolution. In 1800, only 3% of the world’s population lived in cities. Today, more than half of all people call urban areas home, with this figure projected to reach 68% by 2050.
Early urbanization followed predictable patterns. Cities grew around natural harbors, river crossings, and transportation hubs. The introduction of railways and later automobiles fundamentally changed how cities expanded, enabling growth beyond walking distances and creating the suburban sprawl we recognize today.
Economic opportunities draw people to cities where jobs and services concentrate. Manufacturing hubs, financial centers, and technology clusters create magnetic effects that attract workers and businesses.
Population migration from rural areas accelerates urban growth. This includes both domestic migration as people seek better opportunities and international migration as cities become gateways for immigrants.
Infrastructure development enables cities to grow vertically and horizontally. Better transportation, utilities, and communication systems support larger populations and more complex urban structures.
Understanding these historical patterns helps explain why certain visualization approaches work better for different time periods and urban contexts.
Tools and Technologies for Visualizing Urban Growth
Geographic Information Systems (GIS)
GIS technology forms the backbone of modern urban growth analysis. These systems can layer historical maps, satellite imagery, census data, and infrastructure information to create comprehensive views of urban development. Professional GIS consulting services help organizations implement these complex systems, ensuring accurate data integration and meaningful analysis outputs.
GIS platforms excel at temporal analysis, allowing researchers to compare city boundaries, population density, and land use across different time periods. Advanced GIS applications can model growth scenarios, predict future expansion patterns, and identify areas at risk of urban sprawl.
Remote Sensing and Satellite Imagery
Satellite imagery provides unparalleled insights into urban growth patterns. Historical satellite data dating back to the 1970s enables long-term growth analysis, while modern high-resolution imagery captures detailed changes in land use and building density.
Remote sensing technology can automatically detect urban expansion by analyzing changes in surface reflectance, building footprints, and vegetation loss. This automated approach makes it possible to study urban growth at regional or global scales.
Key satellite programs for urban growth analysis include:
- Landsat program (1972-present): Provides consistent, long-term imagery
- SPOT satellites: Offer higher resolution for detailed urban mapping
- Commercial satellites: Deliver near real-time imagery for rapid change detection
Data Visualization Software
Modern data visualization tools transform complex urban datasets into clear, compelling narratives. These platforms can create interactive maps, animated time series, and multi-layered visualizations that reveal growth patterns invisible in static maps.
Popular visualization approaches include:
- Time-lapse animationsshowing urban expansion over decades
- Heat mapsdisplaying population density changes
- Comparative visualizationscontrasting growth patterns between different cities
- 3D modelsillustrating vertical development and skyline changes
Challenges and Considerations
Data Accuracy and Availability
Historical urban data often contains gaps, inconsistencies, and varying quality levels. City boundaries change over time, administrative divisions shift, and data collection methods evolve, creating challenges for longitudinal analysis.
Successful urban growth visualization requires careful data cleaning, standardization, and validation. This includes:
- Reconciling different coordinate systems and map projections
- Adjusting for changing administrative boundaries
- Accounting for differences in data collection methods across time periods
- Validating historical data against multiple sources
Ethical Considerations in Urban Planning
Urban growth visualization can influence policy decisions that affect millions of people. Visualizations highlighting rapid development or population decline can trigger gentrification, displacement, or disinvestment.
Responsible visualization practices include:
- Presenting data in context with socioeconomic factors
- Acknowledging uncertainty and data limitations
- Considering the potential impact of visualizations on communities
- Engaging stakeholders in interpretation and decision-making processes
Future Trends in Urban Growth Visualization
AI and Machine Learning Applications
Artificial intelligence is revolutionizing urban growth analysis. Machine learning algorithms can automatically detect building construction, population changes, and land use transitions from satellite imagery and social media data.
These technologies enable:
- Automated change detectionacross large urban areas
- Predictive modelingof future growth patterns
- Real-time monitoringof urban development projects
- Pattern recognitionidentifying similar growth trajectories across different cities
Real-Time Urban Monitoring
Internet of Things (IoT) sensors, mobile phone data, and social media activity provide unprecedented real-time insights into urban dynamics. These data sources complement traditional visualization methods with current information about population movements, economic activity, and infrastructure usage.
Real-time monitoring enables dynamic visualizations that update continuously, showing daily population flows, seasonal variations in urban activity, and immediate responses to policy changes or external events.
Conclusion
Visualizing urban growth over time transforms abstract demographic and geographic data into powerful tools for understanding and shaping our cities. The combination of GIS technology, satellite imagery, and advanced visualization techniques enables researchers, planners, and policy makers to see patterns that would otherwise remain hidden.